Tested on
Tested on MERIT Hydro at 3 arc-seconds, on three regions of the global partition (5699, 20507 and 20106; the largest has 10.7 million pixels, 178,129 of them with 10 km² or more upstream): the seventeen layers equal those of the C code bit for bit, with the slope's ring read from the global elevation.
The sixteen attributes
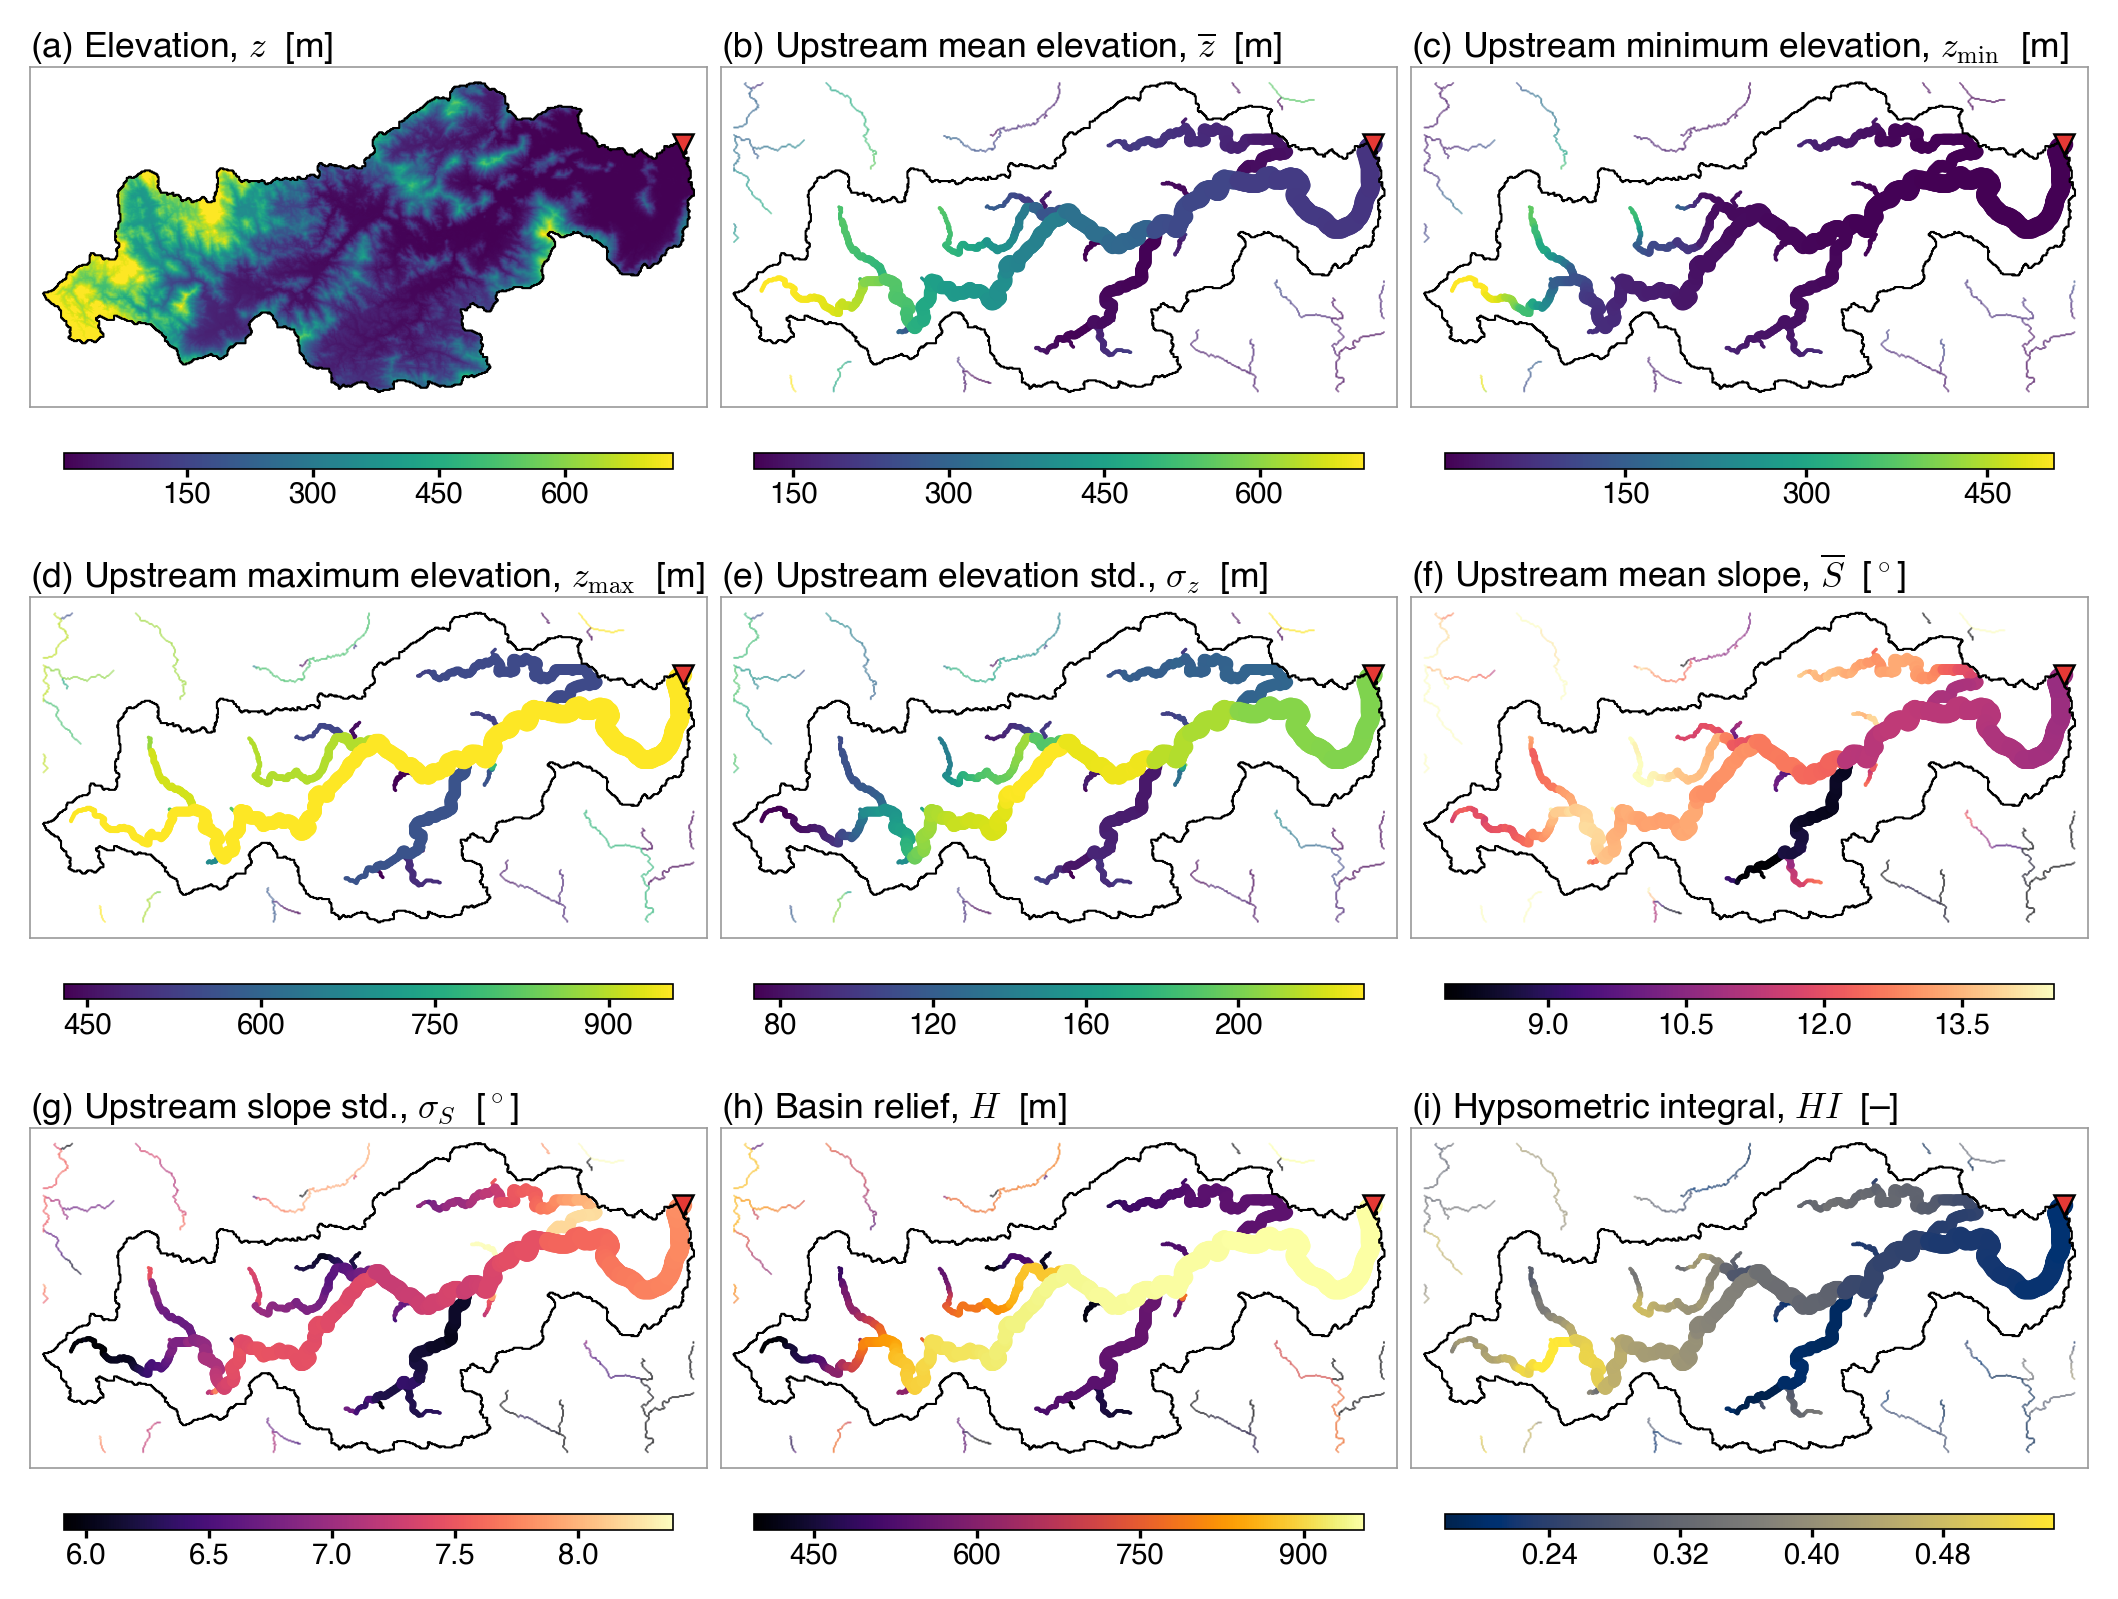
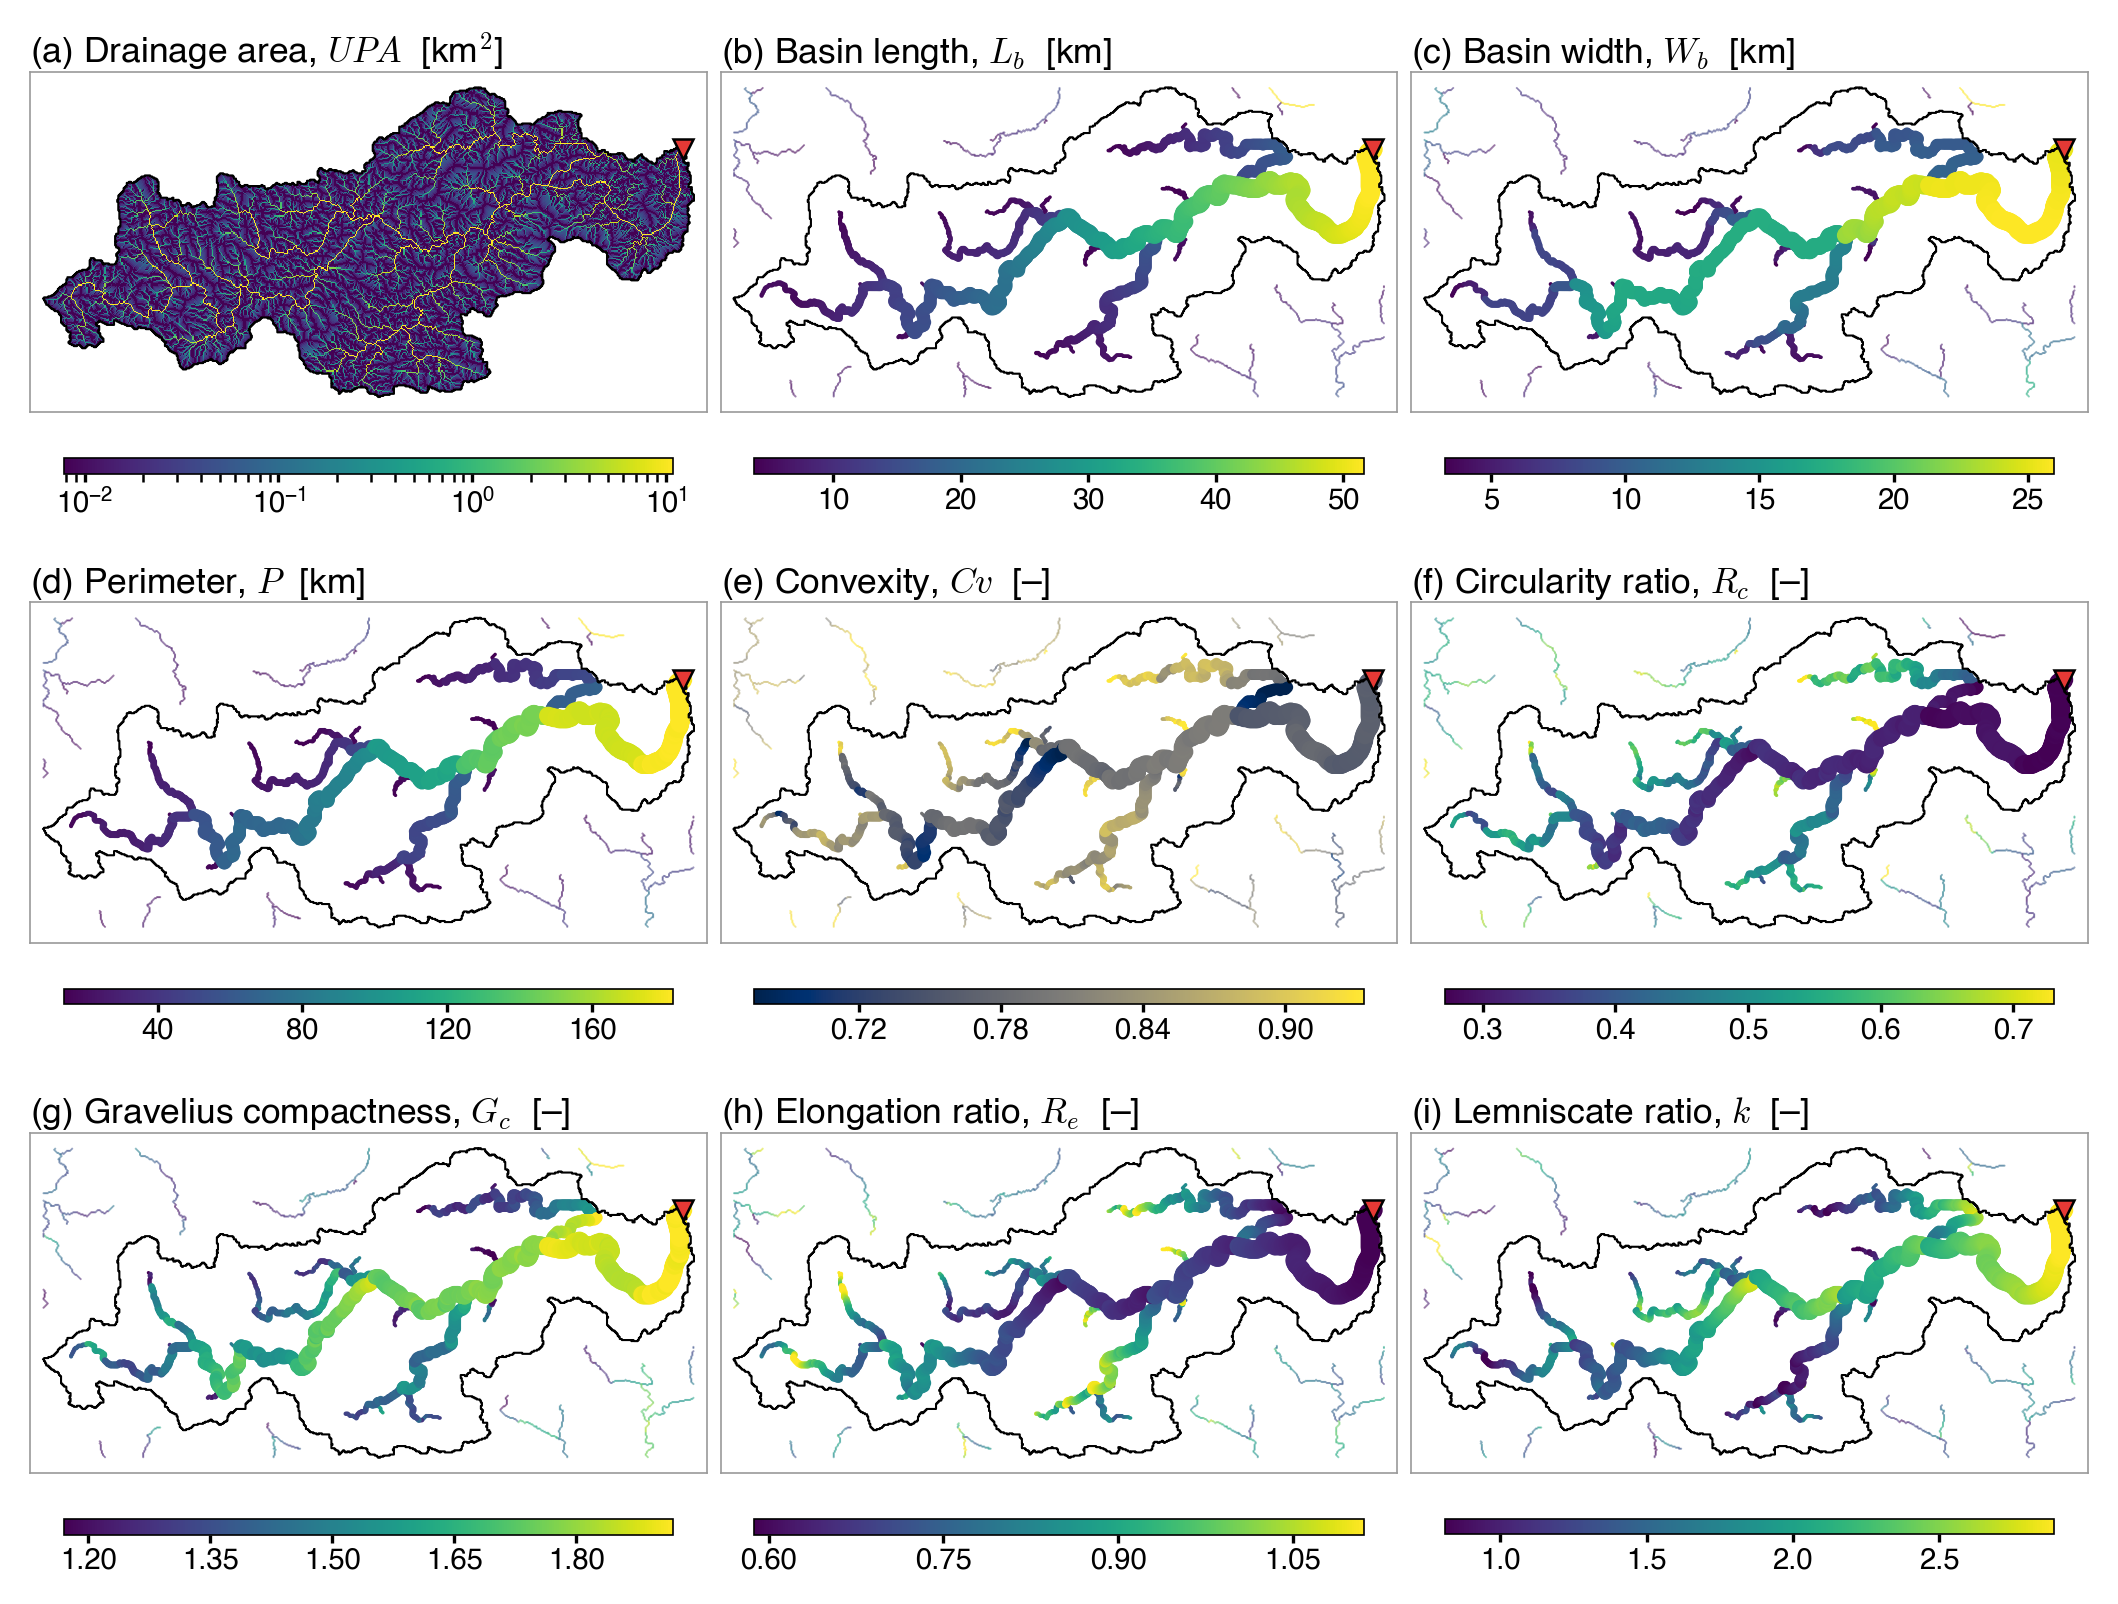
lemniscate_ratio is Chorley's ratio of perimeters; panel (i) shows the parameter k = π L² / (4A) that 0.1 wrote under that name.| # | layer | variable | unit | group |
|---|---|---|---|---|
| 1 | mean_elv | mean upstream elevation | m | upstream aggregate |
| 2 | min_elv | minimum upstream elevation | m | upstream aggregate |
| 3 | max_elv | maximum upstream elevation | m | upstream aggregate |
| 4 | elv_std | upstream elevation standard deviation | m | upstream aggregate |
| 5 | mean_slp | mean upstream slope | deg | upstream aggregate |
| 6 | slp_std | upstream slope standard deviation | deg | upstream aggregate |
| 7 | perimeter_km | catchment perimeter | km | boundary walk |
| 8 | basin_length_km | basin length | km | boundary walk |
| 9 | basin_width_km | basin width | km | boundary walk |
| 10 | convexity | convexity | – | boundary walk |
| 11 | relief | basin relief | m | arithmetic |
| 12 | hypsometric_integral | hypsometric integral | – | arithmetic |
| 13 | elongation_ratio | elongation ratio | – | arithmetic |
| 14 | gravelius | Gravelius compactness | – | arithmetic |
| 15 | circularity | circularity ratio | – | arithmetic |
| 16 | lemniscate_ratio | lemniscate ratio | – | arithmetic |
Written where the upstream area is at least 10 km², −9999 elsewhere; the local slope slp is written as well. The definitions are in the README on GitHub.
How it works
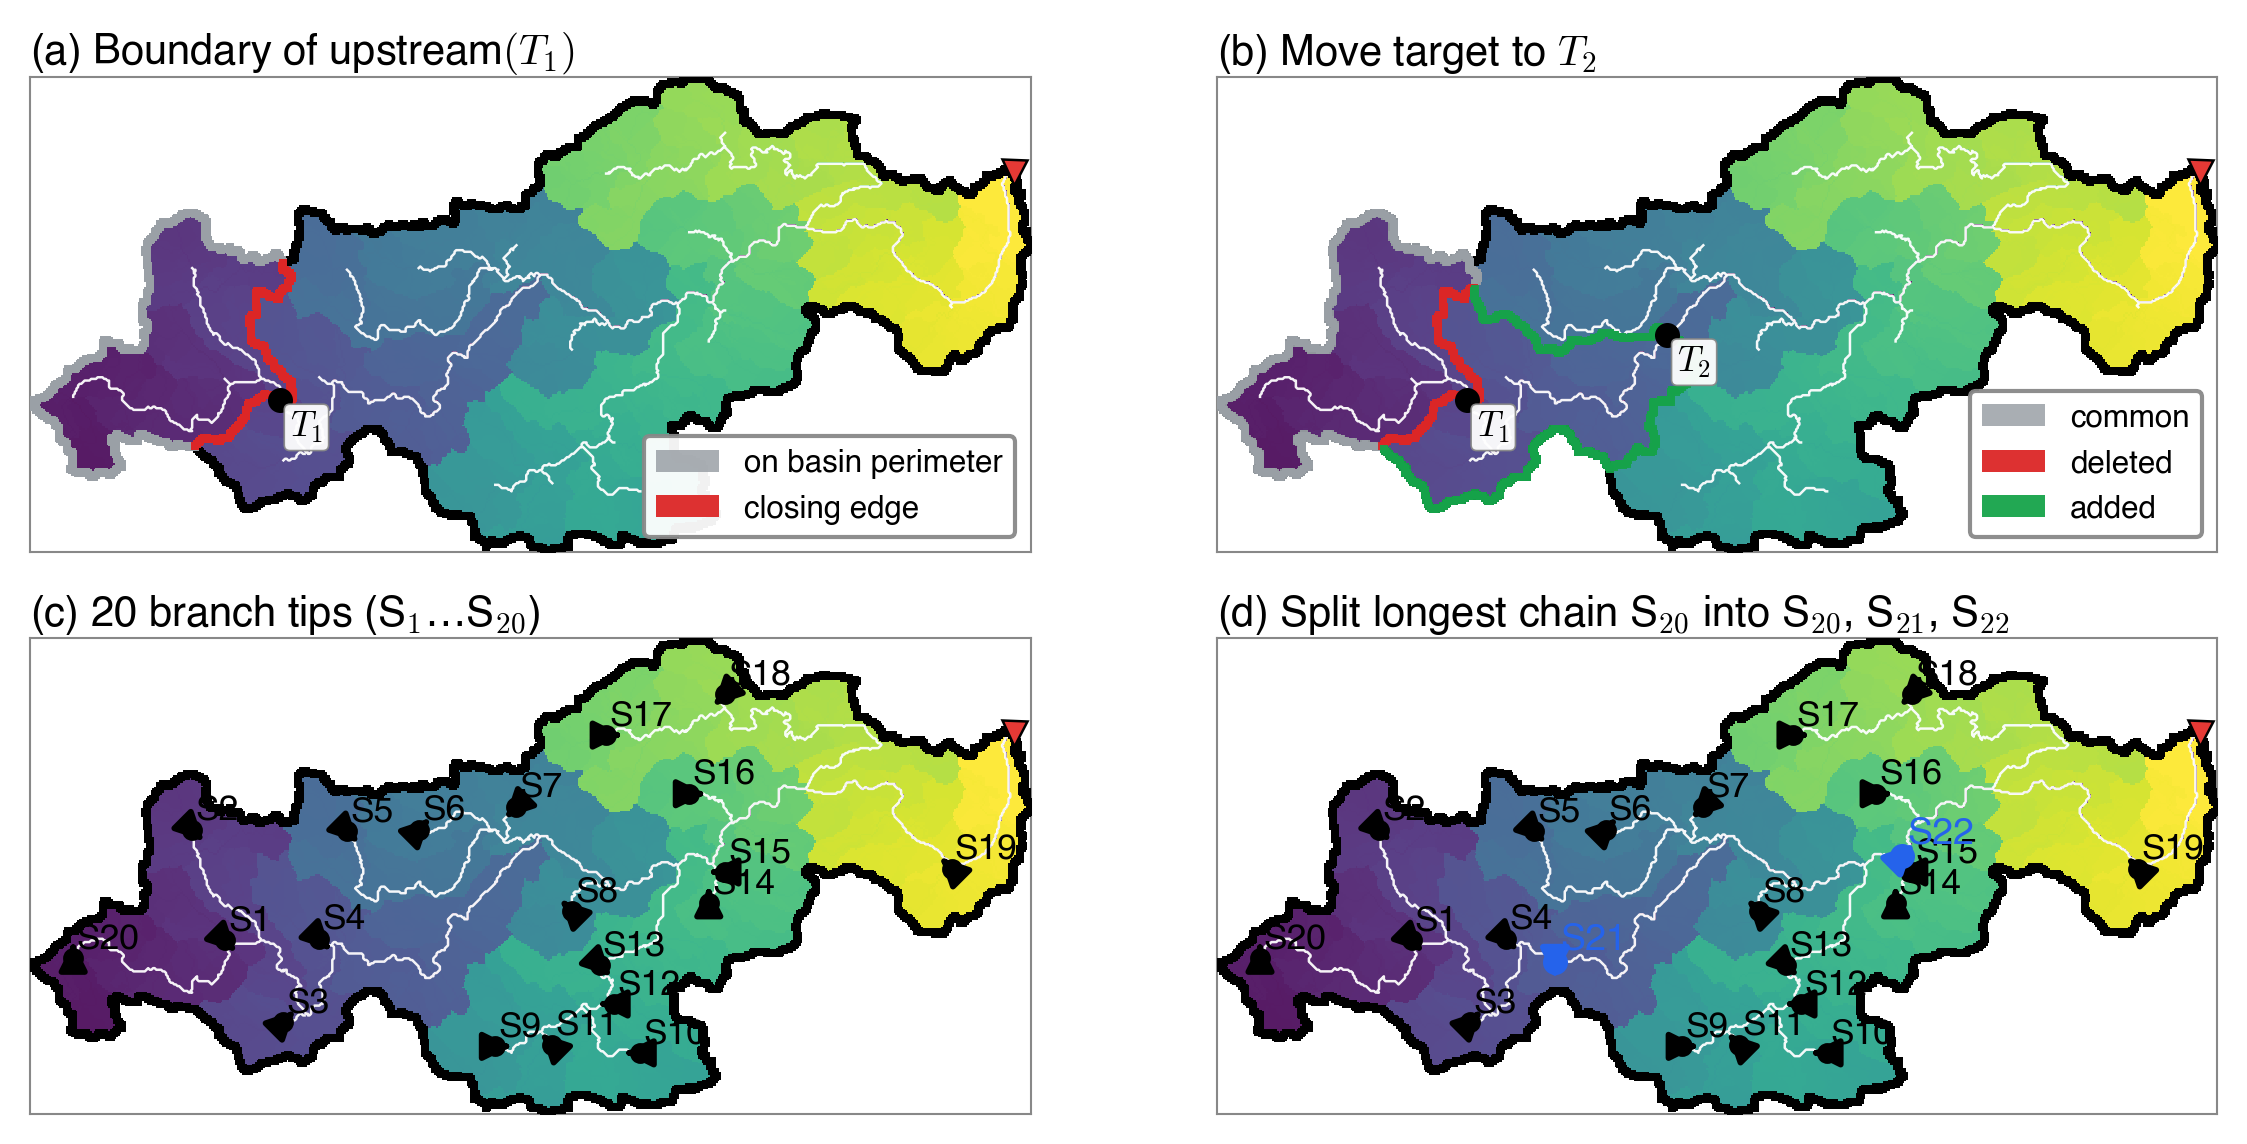
The pixels of each basin are numbered depth first from the outlet (FlowTopo's seq_dfs), so the catchment of a pixel is one run of ranks and "is q upstream of p" is two comparisons. The terrain aggregates take one pass over the ranks. The boundary is walked once for a run of pixels along a stream, and carried from one catchment to the next: only the pixels new to the catchment are tested.
Get it
Python 3.10 or later with numpy, numba, scipy and rasterio.
git clone https://github.com/hellolulujiang/flowmorph.git
cd flowmorph
pip install -e ".[test]"
pytest
import flowmorph
fm = flowmorph.FlowMorph.from_raster("data/dir_example.tif", "data/upa_example.tif", "data/elv_example.tif")
attributes = fm.attributes() # name -> float32 grid, -9999 where not written
fm.write("out") # seventeen GeoTIFFs: slp and the sixteen attributesThe bundled example is one basin of MERIT Hydro in Tasmania (696 km², 110,125 pixels, 2,033 of them with 10 km² or more upstream).
Licence
MIT for the code; see the licence. The bundled MERIT Hydro excerpt keeps its own terms, and the three figures above are Figures 7, 8 and 9 of the FullBasin paper (Earth System Science Data Discussions, CC BY 4.0). Author: Lulu Jiang (lulujiang.me).
